| Party |
% |
# |
| Party of Regions |
31.83% |
5 554 712 |
| Batkivshchyna |
24.22% |
4 226 529 |
| Communist Party |
13.88% |
2 423 665 |
| UDAR |
13.47% |
2 350 751 |
| Svoboda |
9.61 |
1 677 042 |
| Ukraine Forward! |
1.61% |
282 037 |
Before addressing the surprises, a couple of comments on expectations that were fulfilled. The Party of Regions performed best on the list, followed by Batkivshchyna. Ukraine Forward! failed to pass the 5% threshold and Svoboda succeeded. UDAR, in a surprise, did not finish a solid third, but is currently in a virtual tie with the Communist Party. Klitschko had been receiving substantial attention in the days before the vote and his ascent to second place was considered to be a possibility. Instead, it appears that many opposition voters may have selected Svoboda as an alternative. Once the final results are in, I will address these issues in greater detail.
Because precinct electoral commissions are required to report on turnout throughout the day, the official reports on citizen activity should be much closer to final. Overall, turnout in parliamentary elections just about matched its post-Soviet nadir of 57.94% in 2007; turnout on Sunday is reported to be 57.98%.
 |
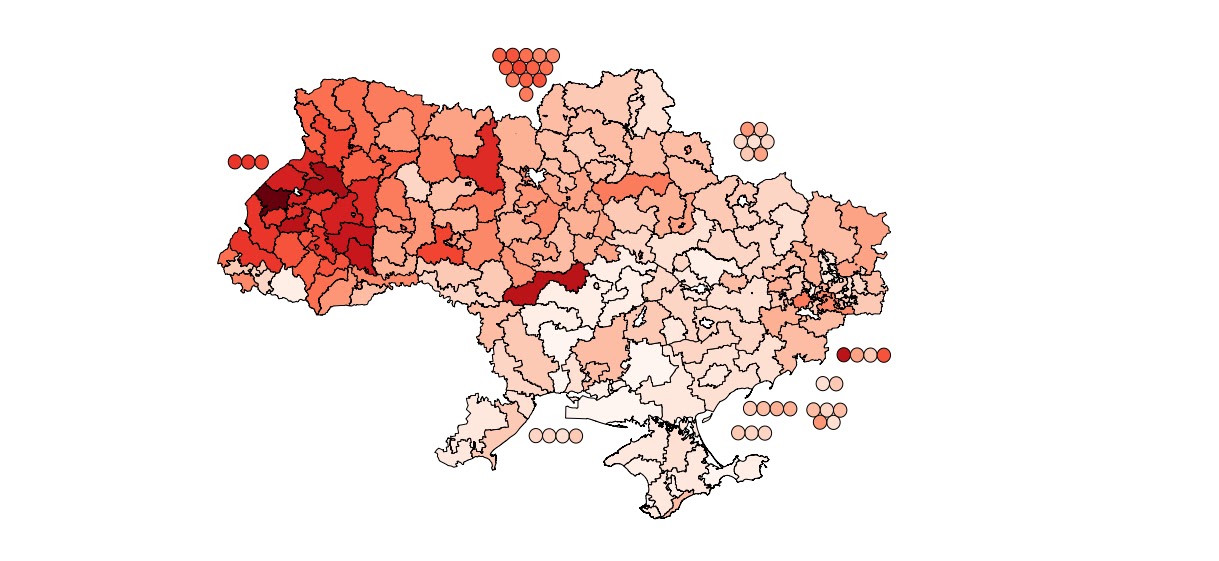
| Turnout by District |
Turnout data reveal some interesting regional patterns of activity, which suggest variation in mobilization success by competing forces. The map above shows district-level turnout across Ukraine as of 8pm on Sunday when the polls closed (using natural breaks (
Jenks) for categories). Activity is notably stronger in western Ukraine (except Zakarpattya) through the central region to Kyiv, with scattered districts showing high levels of activity in Ukraine's east. At the oblast level, western Ukraine exhibits the highest level of mobilization, with L'viv (67%), Ternopil (67%), and Volyn (66%) leading the way. The lowest turnout was in Ukraine's south, with Crimea (49%), Odesa (50%), Sevastopol (50%), and Kherson (51%) at the bottom of the list. Given the level at which Ukrainian citizens express dissatisfaction in surveys with most politicians and institutions (see the most recent IFES survey, for example), voter apathy is not surprising. The imprisonment of opposition leaders and enactment of the language law, however, may have served as a stronger mobilization tool for western interests than for those in the east and south. I will explore variation in party performance by region in a later post (once all the results are in), especially Svoboda's performance outside of its core western regions.
In addition to looking at final turnout figures, it can be interesting to assess the change in turnout during the day. The next two maps show the difference between reported turnout at noon and 8pm, and at 4pm and 8pm in standard deviation terms.
 |
| Difference in Turnout, Noon-8pm (Standard Deviation) |
 |
| Difference in Turnout, 4pm to 8pm (Standard Deviation) |
Patterns of turnout may vary across space based on the work and personal lifestyles of the population. For example, when I was living in L'viv during the 2007 parliamentary election, I noticed a surge of voting in the late morning and early afternoon. Since it was a Sunday, I asked why and was told that locals come to vote after church whereas voters might show up in larger numbers earlier in other regions. I never tested this proposition empirically, but it is plausible. Indeed, the results on the first map would be consistent with it.
The second map shows an outlier - district 101. If one looks at the four hour increments (noon-4, 4-8), the pace of voting tends to taper off as the end of election day approaches. In Ukraine, it increased in three districts: 66, 101, and 153. In 66 and 153, in increased by about 2 percentage points. But, in district 101 the difference was an impressive 19.4 percentage points.
 |
| Proportion of Voters Casting Ballots by Noon |
 |
| Proportion of Voters Casting Ballots by 4pm |
The next two maps look at the data differently, taking the final turnout as the total. The first map shows the proportion of voters who cast ballots by noon, and the second shows the proportion by 4pm. Once again, voters in western Ukraine showed up later in the day relative to their counterparts elsewhere. A couple of districts in other parts of the country - again, notably 101 - are unusual in their turnout. In District 101, only 40% of those who are reported to have voted showed up at the polls by 4pm (the mean for all districts was 78%). This district in Kirovohrad has also only reported 29% of its protocols according to CEC records at the moment. It is particularly worthy of additional scrutiny.
In sum, turnout is low and shows regional variation. Some of this variation may be explained by variation in patterns of life, but other aspects of the variation require more investigation.